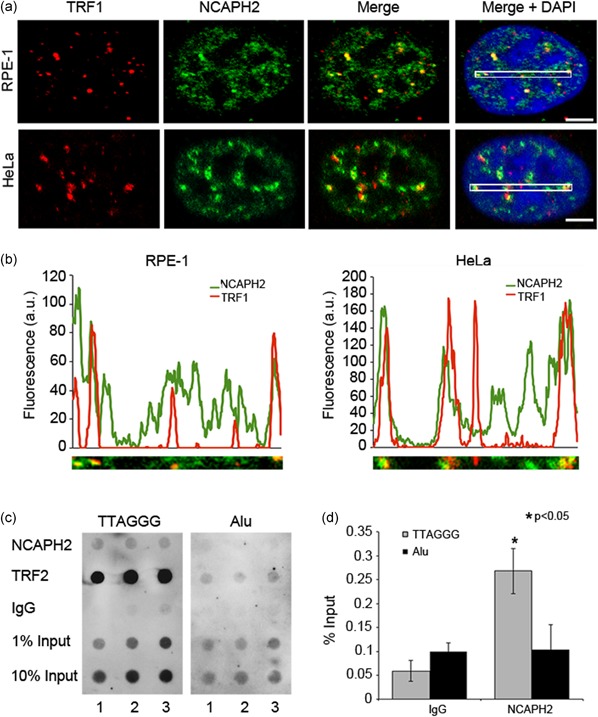
Figure 2.

NCAPH2 associates with telomeric DNA. (a) RPE‐1 and HeLa cells immunostained for anti‐TRF1 (red), anti‐NCAPH2 (green), and DNA (blue). White boxes in Merge + DAPI panels indicate regions analyzed in (b). (b) Fluorescence intensity plots of regions outlined in (a) showing regions of overlap of NCAPH2 and TRF1. (c) ChIP assay in RPE‐1 cells with anti‐NCAPH2, anti‐TRF1, or IgG control. Dot blots were hybridized with a TTAGGG repeat probe (left panel) or Alu repeat probe (right panel). (d) Densitometric analysis of ChIP data in (c) expressed as % input ± SEM of three biological replicates. *p < 0.05, Student's t‐test. DAPI, 4′, 6‐diamidino‐2‐phenylindole [Color figure can be viewed at wileyonlinelibrary.com]
