
Figure 3.
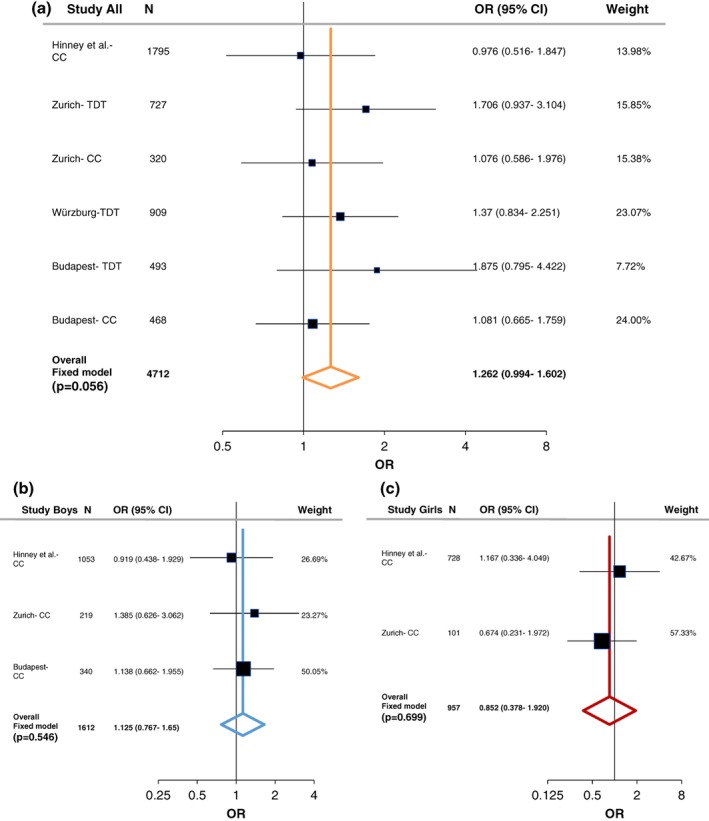
Summary and meta‐analysis of all cohorts and published association analyses of the LRP6 (rs1012672) gene variation with attention‐deficit hyperactivity disorder (ADHD) following sex stratification. (a) Forest plot for rs1012672 in male/female combined cohorts. (b) Forest plot for rs1012672 in males. (c) Forest plot for rs1012672 in females. Black whiskers in the forest plot represent 95% confidence intervals (CI) for odds ratio; the weight of the study is reflected in symbol size. Sample demographics, individual statistics, heterogeneity, literature bias statistics, quality assessments and scores, and type of tests was summarized in Supporting Information Tables S5–S9. Abbreviations: CC = case–control; TDT = transmission disequilibrium test [Color figure can be viewed at wileyonlinelibrary.com]