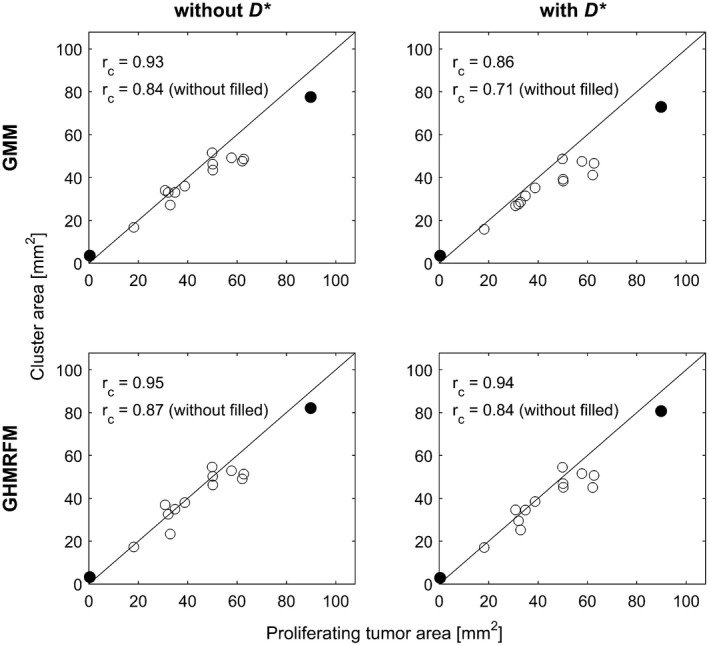
Figure 5.

Scatter plots showing area of cluster with high perfusion and low diffusion identified by IVIM parameter clustering versus proliferating area derived from histological analysis. Lin's concordance correlation coefficient (), based on all data points, and when excluding the largest and smallest data point (filled circles), are shown in each plot along with the line of equality
