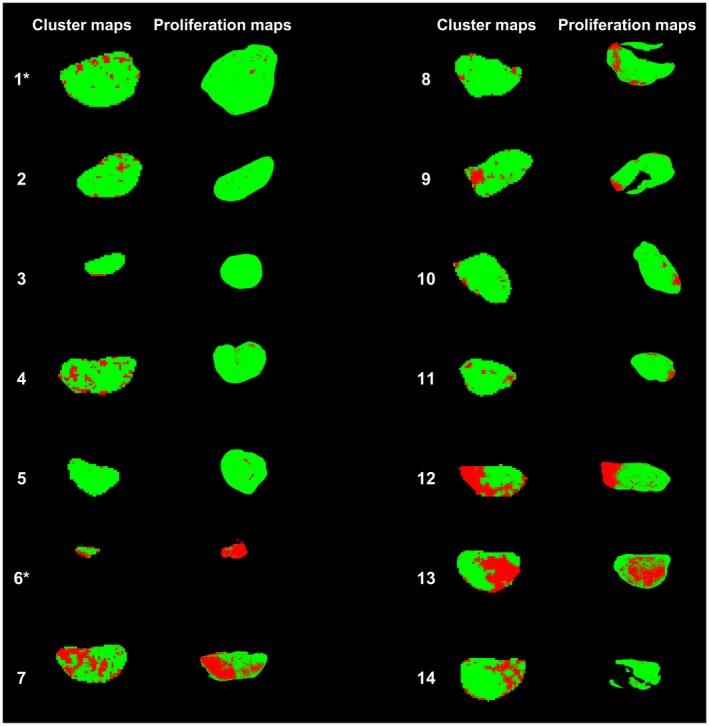
Figure 6.

Cluster maps based on the GHMRFM without (approach with highest Lin's concordance correlation coefficient ()) and thresholded histology‐derived proliferation maps shown side‐by‐side for all tumors in this study. In the cluster maps, green indicates probability belonging to the cluster with high perfusion and low diffusion. In the thresholded proliferation maps, green pixels are above the threshold and are thereby considered to be proliferating. The tumors plotted as filled circles in Figure 5 are marked by an asterisk (*)
