
Figure 2.
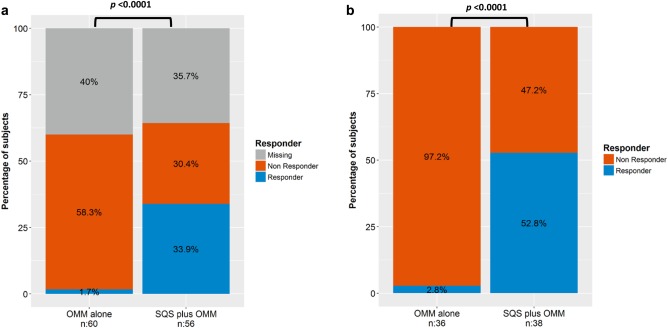
a. Primary endpoint responder rate by treatment groups: ITT (n = 116). b. ITT—considering only patients who had the chance to reach Month 9 visit.
Official websites use .gov
A
.gov website belongs to an official
government organization in the United States.
Secure .gov websites use HTTPS
A lock (
) or https:// means you've safely
connected to the .gov website. Share sensitive
information only on official, secure websites.
a. Primary endpoint responder rate by treatment groups: ITT (n = 116). b. ITT—considering only patients who had the chance to reach Month 9 visit.