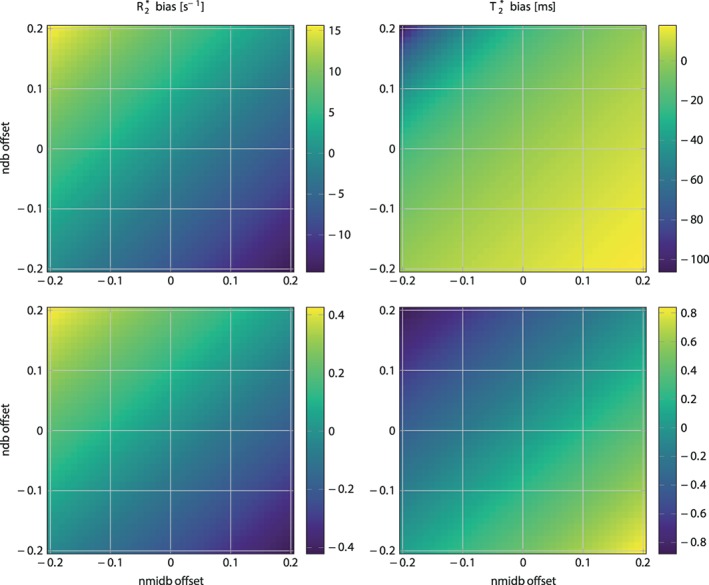
Figure 2.

R2* (left) / T2* (right) bias in simulated 6 echo (top) and 20 echo (bottom) data depending on variations of ndb and nmidb offset around ground values of ndb = 2.83, nmidb = 0.74 for a fixed chain length (CL) = 17.5. Note how the bias range reduces drastically when comparing the top to bottom row. ndb: number of double bonds; nmidb: number of methylene‐interrupted double bounds.
