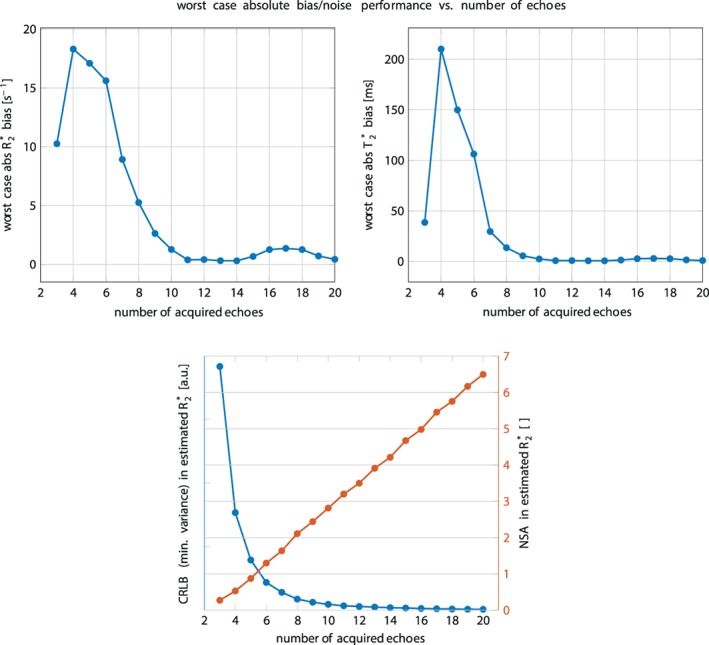
Figure 3.

Top: Worst‐case absolute R2* (left) / T2* (right) bias vs. number of sampled echo times. While with typically acquired 6 echoes the bias is still very high, a higher number of echoes increases the accuracy. Bottom: Noise performance for the R2*‐estimate vs. number of sampled echo times. On the left blue axis the Cramér–Rao lower bound (CRLB) of the general variance is depicted. On the right red axis the number of signal averages computed by NSA = number of echoes × CRLBmin/CRLB is plotted.
