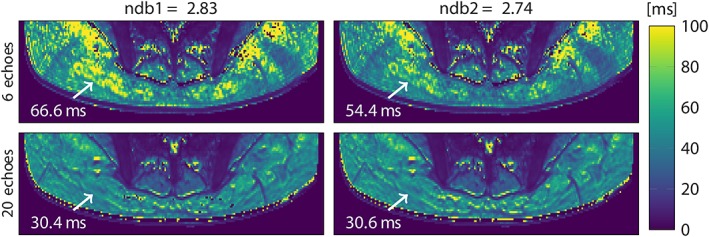
Figure 4.

T2* maps in the gluteal region of a representative healthy subject, reconstructed from 6 (top) and 20 echoes (bottom) with 9‐peak fat spectra of only slightly varying peak amplitudes (ndb1 and ndb2). Arrow annotations show the estimated T2* voxel values. ndb: number of double bonds.
