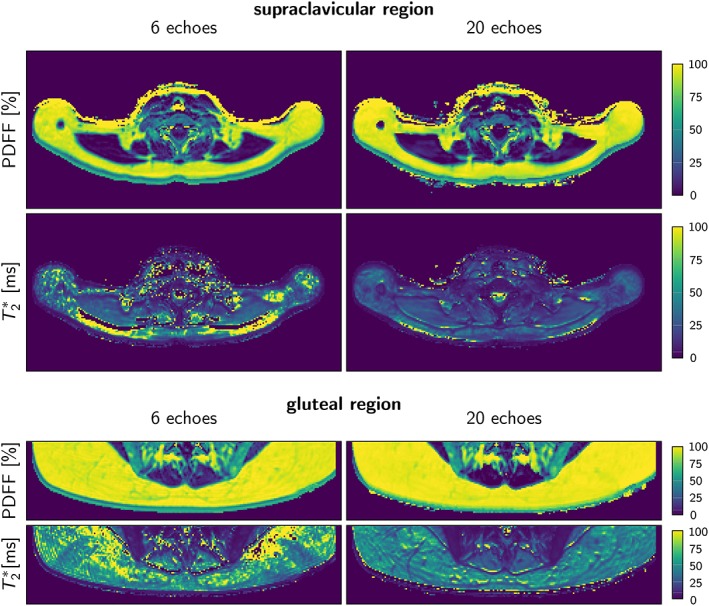
Figure 5.

Representative PDFF and T2* maps using 6 echoes and 20 echoes in the supraclavicular and gluteal regions of one subject. Note the higher noise and the extent of artifacts in the T2*‐map with 6 compared with 20 echoes. PDFF: proton density fat fraction.
