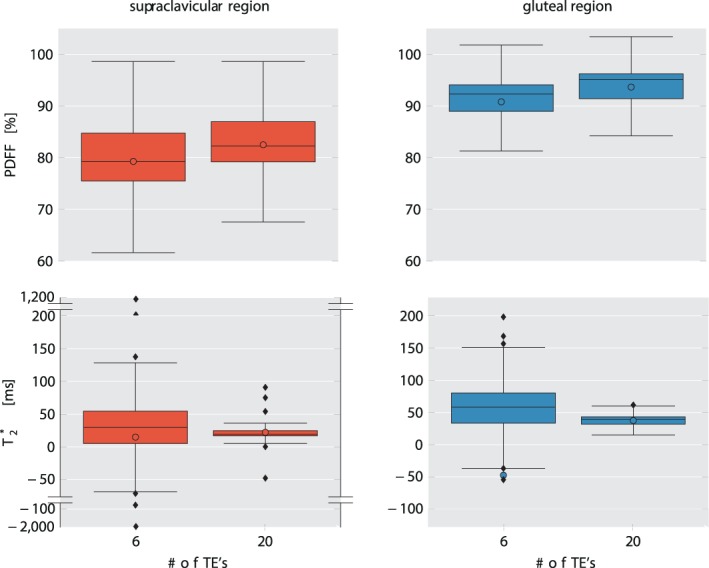
Figure 6.

Comparison of PDFF (top row) and T2* (bottom row) values in supraclavicular fat (left column) and gluteal fat (right column) from 6‐echo and 20‐echo‐data. Mean values are shown as colored circles, median values are represented by the vertical line within the boxes. Outliers are shown using a "broken" y‐axis for supraclavicular T2* values. Note the increased range of the T2* values in both supraclavicular and gluteal fat when using the 6‐echo data. PDFF: proton density fat fraction.
