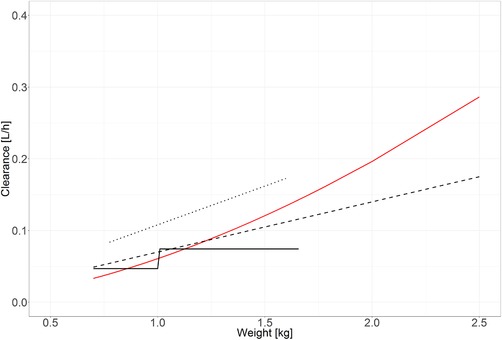
Figure 4.

Comparison of clearance vs weight of the current analysis with literature; the red line represents the function of the current model; the solid black line represents the clearance estimates of Lee et al11; the dotted line represents the clearance estimates of de Wildt et al19; the dashed line represents the clearance estimates of Burtin et al.10 All estimates are displayed for the population ranges included in the respective studies only.
