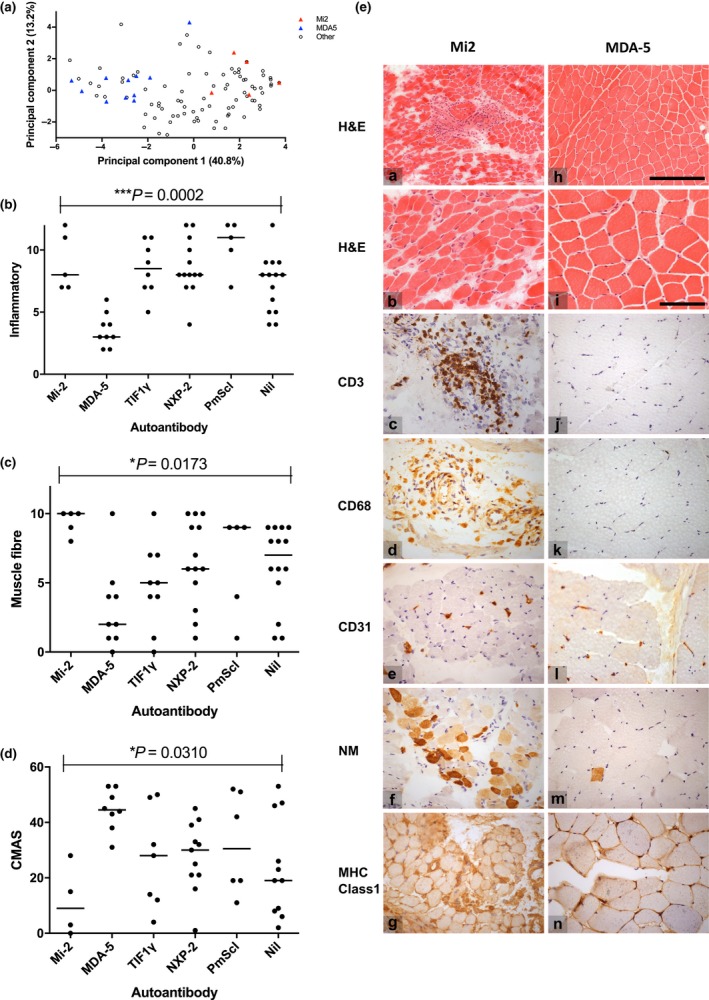
Figure 1.

MDA5 and Mi‐2 autoantibody groups define clusters of mild and severe pathology (a) Principal component analysis of each feature of the biopsy tool for each biopsy sample. Each symbol indicates an individual case, plotted on the two principal components that capture the most variance in the data, with the percentage of variance captured given in parentheses. Triangles are coloured according to auto‐antibody groups as indicated. (b,c) Domain totals for each of the domains in the juvenile dermatomyositis biopsy score tool according to autoantibody subgroups. The inflammatory domain represents the sum of scores for CD3 and CD68 positive endomysial, perimysial and perivascular cells, the muscle fibre domain represents the sum of scores for MHC class I expression, neonatal myosin expression, perifascicular and non‐perifascicular atrophy and fibre degeneration and regeneration, and internal nucleation. Kruskal–Wallis anova was performed to compare the distribution of domain totals across myositis‐specific antibodies/myositis‐associated antibodies subgroups. Post‐hoc analysis indicated that the inflammatory domain scores differed between the anti‐Mi2 and anti‐MDA5, anti‐MDA5 and anti‐TIF1γ, and anti‐MDA5 and anti‐NXP2 cases. The muscle fibre domain scores differed between the anti‐Mi2 and anti‐MDA5 cases. Nil: no autoantibody bands detected on immunoprecipitation analyis. (d) Correlation of autoantibody group and muscle weakness, as assessed by the Childhood Myositis Assessment Scale (CMAS). Kruskal–Wallis anova was used to compare the degree of muscle weakness across autoantibody subgroups. Post‐hoc comparisons indicated that CMAS differed between the anti‐Mi2 and anti‐MDA5 cases, with Mi2 cases being much weaker. (e) Representative micrograph images of representative Mi2 (a–g) and MDA5 (h–n) muscle biopsies. Mi2 cases typically had high levels of inflammation, fibre damage and vessel abnormalities, while MDA5 cases had a much more normal appearance with only mild fibre size variation. a,b,h,i – Haematoxylin & Eosin (H&E), c,j – CD3, d,k – CD68, e,l – CD31, f,m – neonatal myosin, g,n – MHC class1. Scale bars for micrographs a and h are shown in h, length 250 μm, scale bars for b–g and i–n shown in i, length 100 μm.
