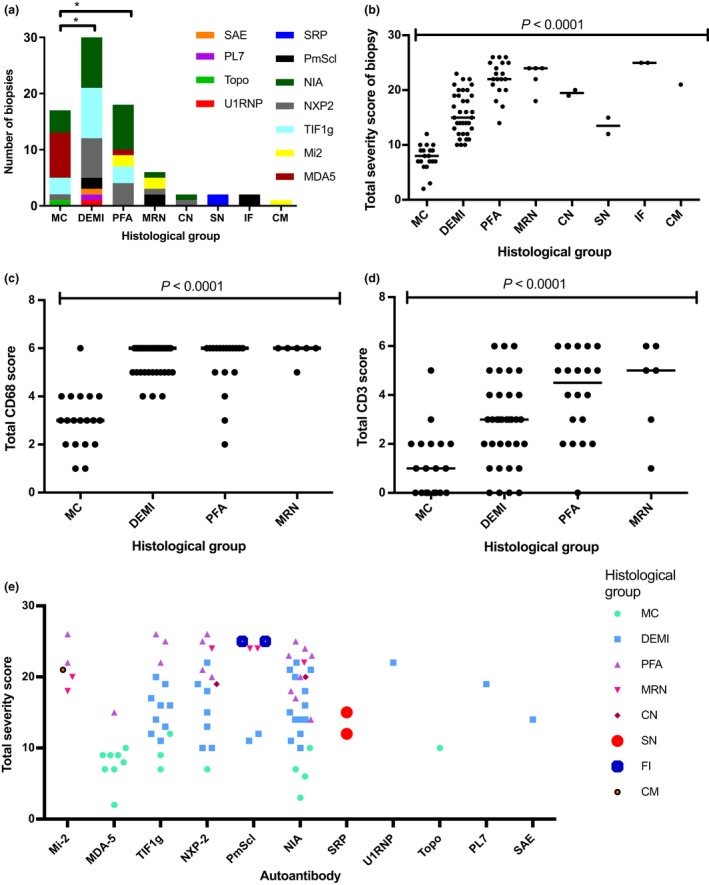
Figure 4.

Serological profiles of the histological groups and correlation of the histological groups with the JDM severity score tool results. Patients were included in the analysis if they were untreated at the time of biopsy and if serological data were available (83/101). (a) Analysis of serological profiles of the histological groups. The MC group has a significantly different serological profile from the DEMI group (P = 0.002) and the PFA group (P = 0.041; Chi‐square test), while no statistically significant difference was apparent between DEMI and PFA (P = 0.3) or between PFA and MRN (P = 0.08); chi‐square test for all comparisons; *P < 0.05. (b) Total severity score from the international score tool as correlated with dominant fibre pathology. (c,d) Correlation of more frequent pathological patterns with lymphocytic and macrophage infiltrates. Total CD3 and CD68 scores are the sums of endomysial, perimysial and perivascular scores from the international score tool. (e) Plot of severity scores across autoantibody groups subclassified according to dominant fibre pathology. MC, minimal change; DEMI, diffuse endomysial macrophage infiltrates; PFA, perifascicular atrophy; MRN, macrophage rich necrosis; CN, clustered necrosis; SN, scattered necrosis; FI, fibre invasion; CM, chronic myopathic change.
