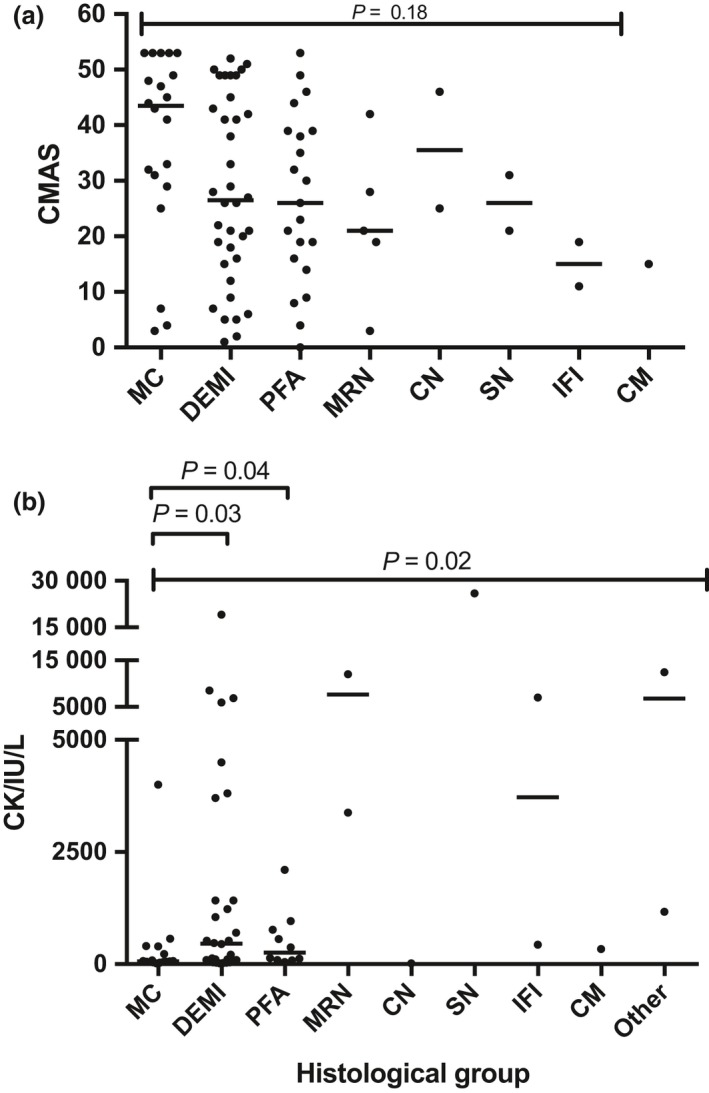
Figure 6.

Correlation of (a) CMAS score and (b) CK levels with histological groups. CMAS scores were available for 88 untreated patients while CK levels were available for 73 untreated patients. Groups with small sample size (n < 2) were excluded from the statistical analysis. Bars indicate median; multiple comparisons by Kruskal–Wallis test, individual comparisons by Mann–Whitney test. CMAS, Childhood Myositis Assessment Scale; MC, minimal change; DEMI, diffuse endomysial macrophage infiltrates; PFA, perifascicular atrophy; MRN, macrophage rich necrosis; CN, clustered necrosis; SN, scattered necrosis; IFI, inflammatory fibre invasion; CM, chronic myopathic change.
