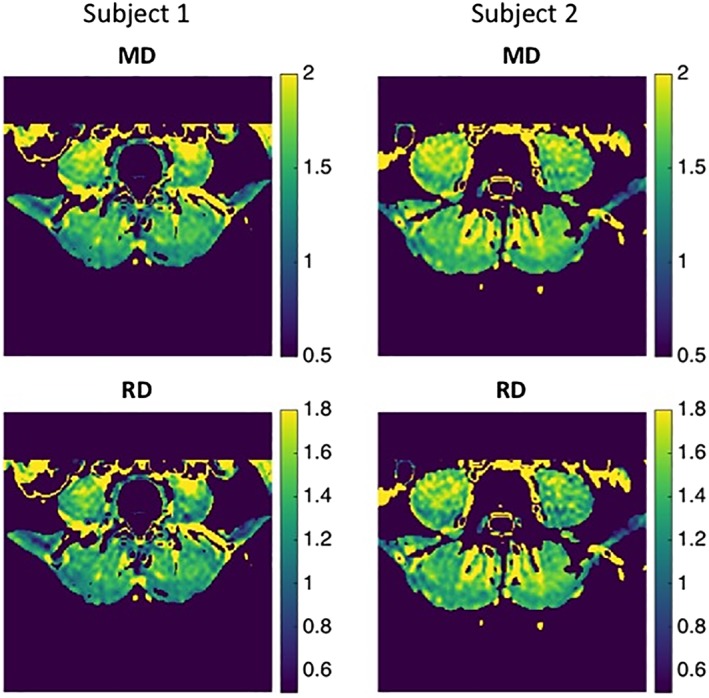
Figure 3.

Representative MD‐ and RD‐maps of two subjects. Subject 1 (female, 22 years, BMI: 27.3) and Subject 2 (male, 33 years, BMI: 27.1) were observed to have the lowest (1) and highest (2) relative extension strength values among the examined cohort, respectively. MD and RD maps are shown in units of 10‐9 m2/s.
