Figure 2.

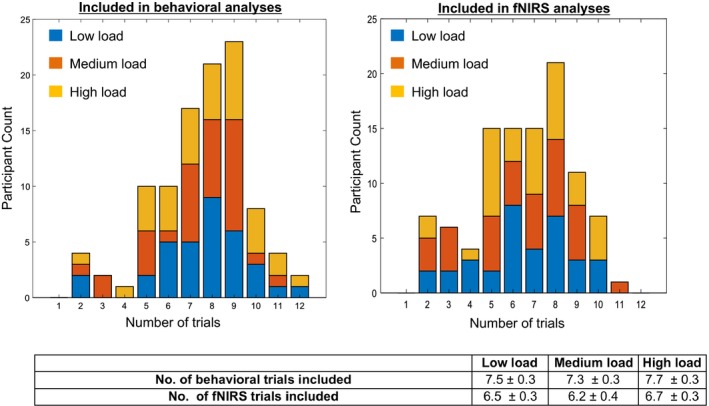
Histograms showing the participant count and trial count (bins) per load in the behavioural (left) and functional near infrared spectroscopy (fNIRS) (right) analyses

Histograms showing the participant count and trial count (bins) per load in the behavioural (left) and functional near infrared spectroscopy (fNIRS) (right) analyses