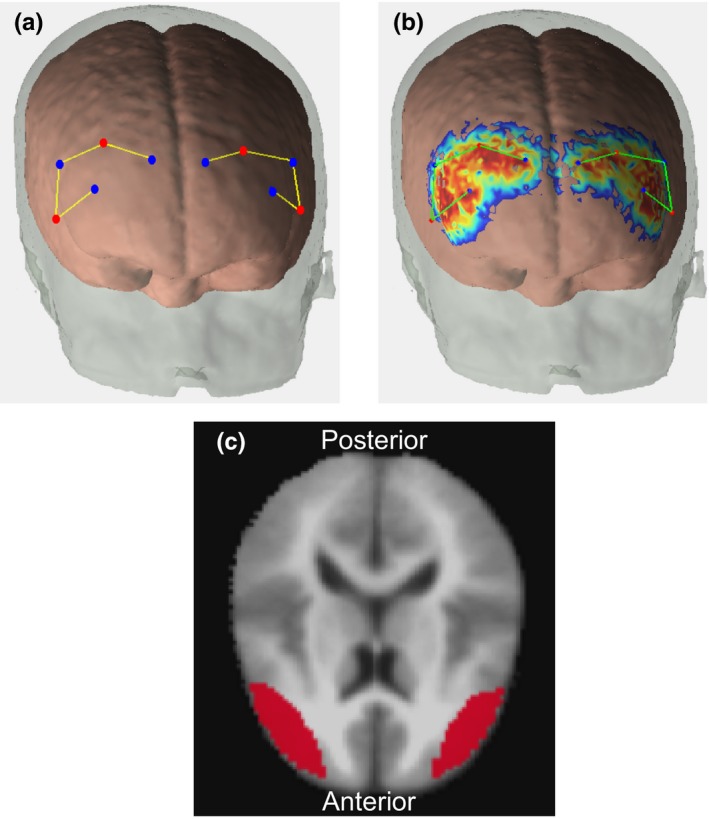
Figure 4.

(a) Functional near infrared spectroscopy (fNIRS) probe geometry covering the frontal cortex on a single participant. Dots in red indicate sources and dots in blue indicate detectors. (b) Photon migration paths from running Monte Carlo simulations on a single participant. (c) Intersection mask of voxels containing data from at least 75% of the participants
