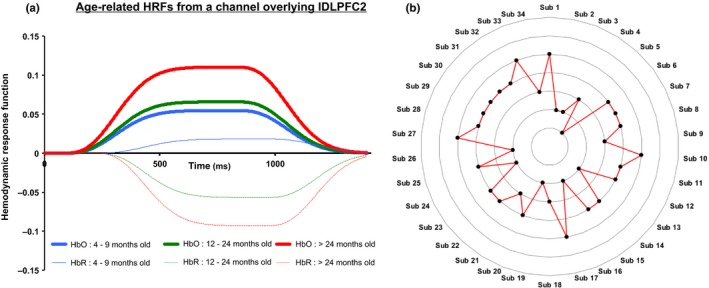
Figure 10.

(a) Haemodynamic response functions (HRFs) for oxyhaemoglobin (HbO) and de‐oxyhaemoglobin (HbR) activation for three age groups obtained from a channel overlaying lDLPFC2. (b) Radar plot showing individual differences across the 34 participants. The seven rings represent seven significant effects from Table 2 (based on associations between HbO activation and behavioural/demographic variables). For instance, participants 1, 10, 17, 27 and 33 showed ideal activation patterns in five out of seven effects, whereas participant 5 showed ideal activation pattern in only one effect. Refer to main text for an elaborate description
