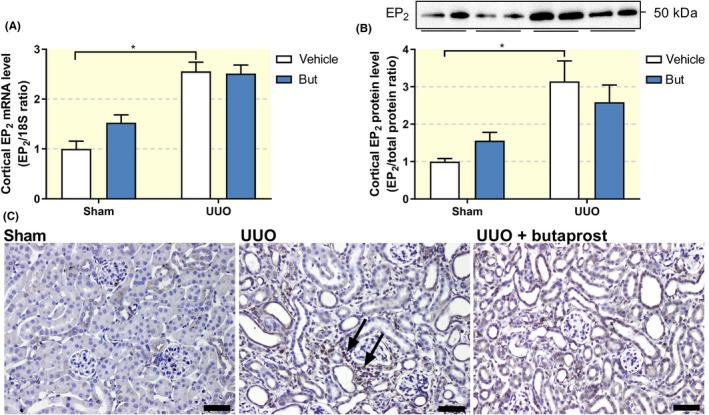
Figure 3.

Impact of UUO and butaprost on EP2 receptor expression in vivo. Mice were subjected to 7 days of UUO and treated with butaprost (4 mg/kg). (A) Gene expression was studied by qPCR. Relative expression was calculated using the reference gene 18S (n = 6‐10). (B) Cortical EP2 protein expression was studied using western blotting (n = 6‐10). (C) Representative immunohistochemistry images showing EP2 expression. 20× magnification, scale bar is 50 μm. Arrows indicate EP2‐positive interstitial cells. Data are presented as mean ± SEM. *P < 0.05
