Figure 4.

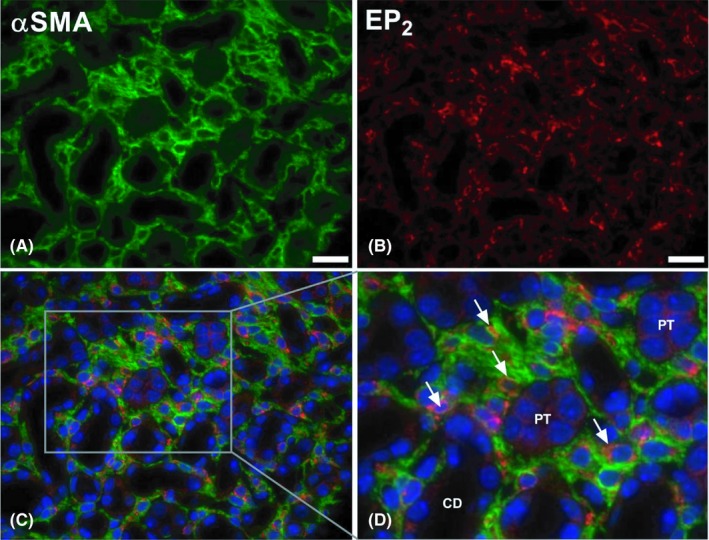
Expression of the EP2 receptor in fibrotic renal tissue. Mice were subjected to 7 days of UUO. Afterwards, the UUO kidney was harvested and used for fluorescence microscopy. Representative image of immunolabeling for (A) αSMA (green) and (B) the EP2 receptor (red). (C, D) Representative image of co‐immunolabeling (αSMA, green; EP2 receptor, red) counterstained with DAPI (blue). 40× magnification, scale bar is 20 μm. Arrows indicate EP2‐positive myofibroblasts. CD = collecting duct, PT = proximal tubule
