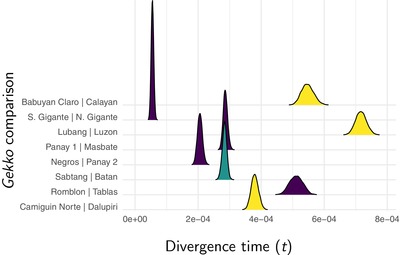
Figure 5.

Approximate marginal posterior densities of divergence times (in expected substitutions per site) for each pair of Gekko populations. The density plot of each pair is color coded to indicate whether the islands were connected during glacial periods (Fig. 1). Figure generated with ggridges Version 0.4.1 (Wilke 2018) and ggplot2 Version 2.2.1 (Wickham 2009).
