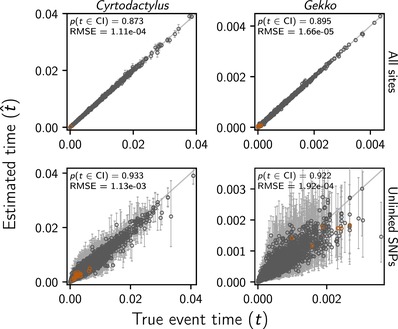
Figure 6.

The accuracy and precision of ecoevolity divergence‐time estimates (in units of expected subsitutions per site) when applied to data simulated to match our Cyrtodactylus (left) and Gekko (right) RADseq datasets with all sites (top) or only one SNP per locus (bottom). Each circle and associated error bars represents the posterior mean and 95% credible interval for the time that a pair of populations diverged. Estimates for which the potential‐scale reduction factor was greater than 1.2 (Brooks and Gelman 1998) are highlighted in orange. Each plot consists of 4000 estimates—500 simulated datasets, each with eight pairs of populations. For each plot, the root‐mean‐square error (RMSE) and the proportion of estimates for which the 95% credible interval contained the true value——is given. Figure generated with matplotlib version 2.0.0 (Hunter 2007).
