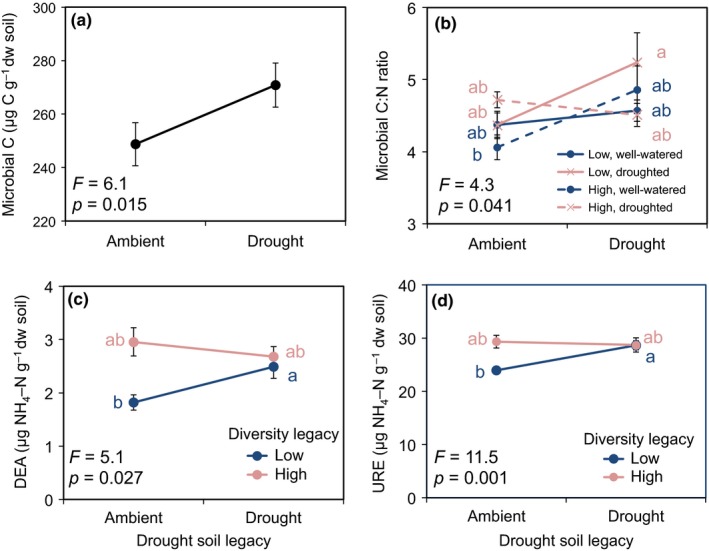
Figure 4.

Microbial C (carbon) (panel a) of soils from ambient and drought legacy; microbial carbon‐to‐nitrogen (C:N) ratios (panel b) of soils from ambient and drought legacy, low and high diversity legacy soils that were well‐watered and droughted; amino acid deaminase (DEA) (panel c) and urease (URE) (panel d) measurements of soils from low and high diversity legacy, and ambient and drought legacy. Data are averaged across the two study species (Alopecurus pratensis, Holcus lanatus). Within each panel, points accompanied by the same lower case letter do not differ at p < 0.05 (Tukey's HSD). Data are means ± 1 SE (n = 138). ANOVA results are presented in Supporting Information Tables S6 and 7Sa,b
