
Figure 3.
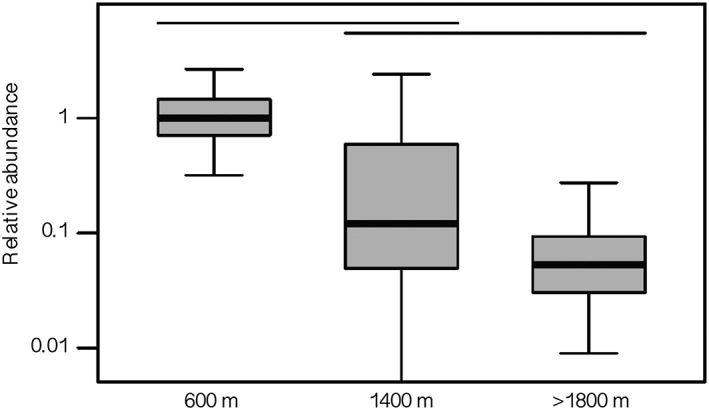
Relative abundance of Saccharomyces in patches at three different altitudes.
Abundance is reported relative to the abundance of Saccharomyces in the patch at 600 m. Box plots show 50% (boxes) and 95% (whiskers) confidence intervals around the observed relative abundance. Our bootstrap analysis could not identify a lower bound for the 95% confidence interval around the abundance of Saccharomyces in the patch at 1400 m. Abundance in patches under the same horizontal line are not significantly different (study‐wide type I error rate α = 0.05).