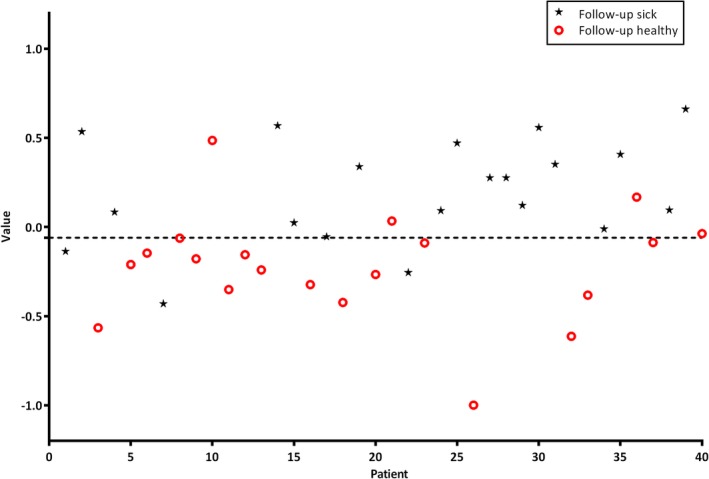
Figure 1.

Scatterplot of individual predictive values of each patient (threshold −0.06). Values >−0.06 are scored as being positive for cancer. The black asterisks are follow‐up patients with histopathologically confirmed head and neck cancer and the red circles represent healthy tumor‐free follow‐up patients [Color figure can be viewed at wileyonlinelibrary.com]
