
Figure 1.
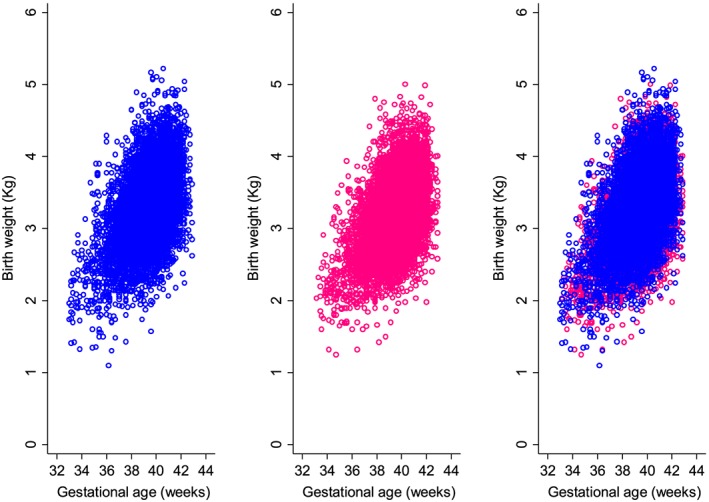
Scatter plot of birthweight measurements according to gestational age for boys (left, blue), girls (middle, pink), and girls and boys superimposed (right) [Colour figure can be viewed at wileyonlinelibrary.com]
Official websites use .gov
A
.gov website belongs to an official
government organization in the United States.
Secure .gov websites use HTTPS
A lock (
) or https:// means you've safely
connected to the .gov website. Share sensitive
information only on official, secure websites.
Scatter plot of birthweight measurements according to gestational age for boys (left, blue), girls (middle, pink), and girls and boys superimposed (right) [Colour figure can be viewed at wileyonlinelibrary.com]