Figure 2.

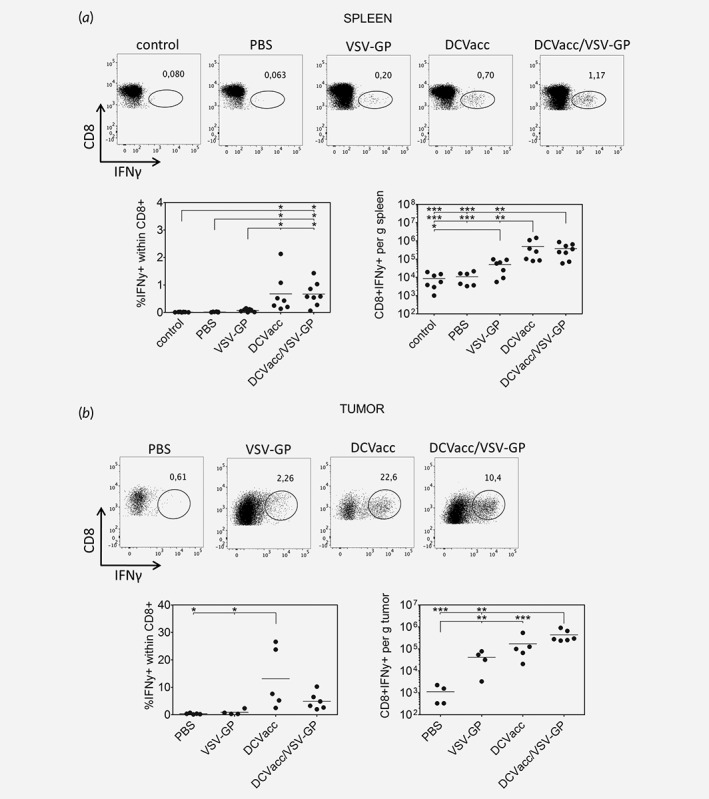
Comparable levels of OVA‐specific IFNγ producing CD8 T cells upon DCVacc and DCVacc/VSV‐GP therapies. B16‐OVA melanoma in C57BL/6 mice were treated i.t./p.t. on Days 11 and 18 posttransplantation with PBS (control), VSV‐GP (6 × 10⁷ PFU), DCVacc (2 × 10⁵ OVA‐loaded CpG‐matured bmDCs) or DCVacc/VSV‐GP. Seven days after the second treatment spleen (a) and cells from B16‐OVA tumors (b) were isolated. Cells were stimulated in vitro with OVA peptide and the production of IFNγ was measured by FACS. FACS dot plots depicting CD8 positive cells (y‐axis) and intracellular IFNγ (x‐axis) within the CD45+ CD3+ cell population show representative data from the different treatment groups. Data represent cumulative results of two independent experiments. Data were analyzed by ANOVA followed by Tukey's multiple comparisons test (*p ≤ 0.05,**p ≤ 0.01,***p < 0.001).
