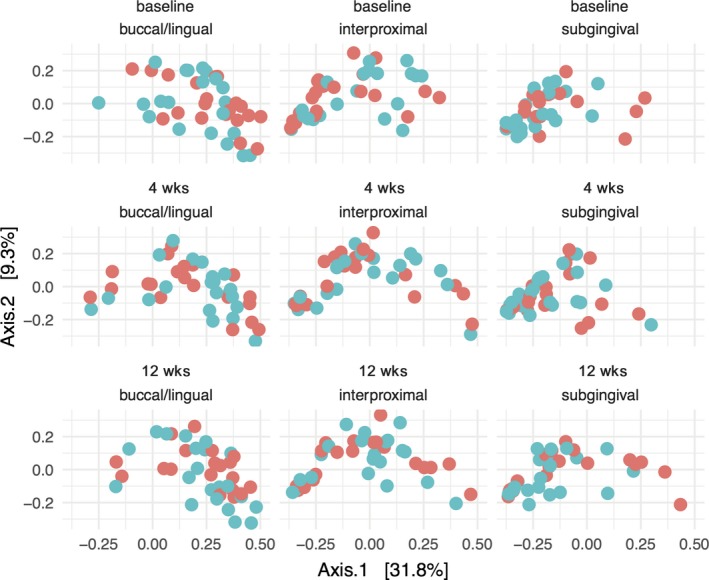
Figure 4.

PCoA scatterplots of beta diversity during periodontal therapy. Samples are visualized by dots, which are colored red for the HA and blue for the AmF/SnF2 group. Each row represents a different time point: baseline, 4 weeks after supragingival debridement, and 8 weeks after supragingival and subgingival debridement. Each column represents the site where the sample was taken from supragingival buccal and lingual (buccal/lingual), supragingival interdental (interproximal), subgingival interdental (subgingival) not accessible for daily oral hygiene. The ordination was constructed using a Bray‐Curtis distance matrix. Principal component 1 (Axis 1) and principal component 2 (Axis 2) are plotted on the x‐ and y‐axes, respectively. The percentage of variation explained by the plotted principal coordinates is indicated on the axes
