
Figure 5.
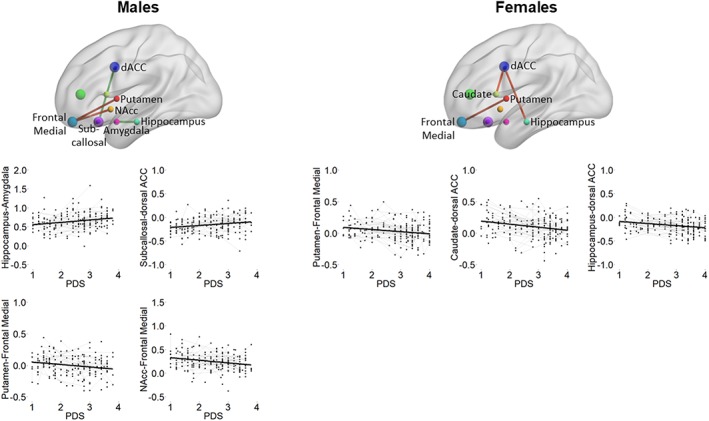
Spaghetti plots indicating a significant fitted line of pubertal development on top of the raw longitudinal data for males (left panel) and females (right panel). Location of region of interest (ROI) is indicated schematically as dots, visualized with the BrainNet viewer (Xia et al., 2013, http://www.nitrc.org/projects/bnv/). Green lines between ROIs indicate Pubertal Development Scale (PDS)‐related increases, and red lines indicate PDS‐related decreases [Color figure can be viewed at http://wileyonlinelibrary.com]