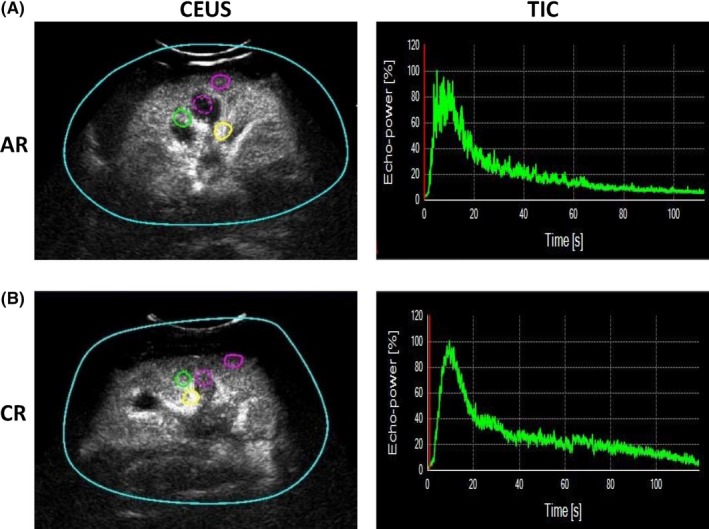
Figure 1.

CEUS quantification measurement and TIC. A, The 4 regions of interest were demonstrated. Yellow circle: segmental artery; green circle: interlobar artery; purple dotted circle: medulla; purple solid circle: cortex. B, In AR and CR kidneys, the TIC was coarse, especially in the AR kidney, with apparent ups and downs. In addition, the peak of the TIC for CR was sharper than AR
