
Figure 3.
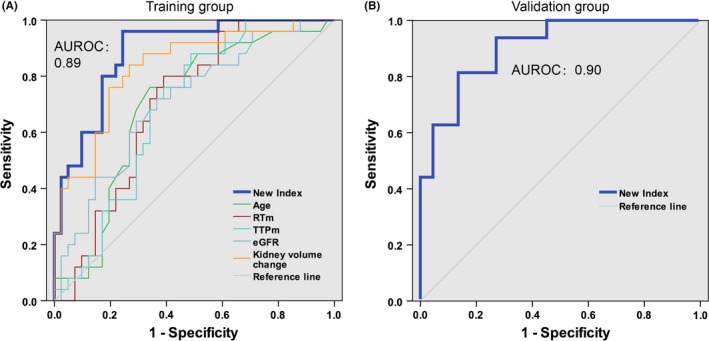
Area under ROC curves. AUROCs estimated the diagnostic performance of the new index, age, RTm, TTPm, eGFR and kidney volume change in the derivation group (A) and validation group (B)
Official websites use .gov
A
.gov website belongs to an official
government organization in the United States.
Secure .gov websites use HTTPS
A lock (
) or https:// means you've safely
connected to the .gov website. Share sensitive
information only on official, secure websites.
Area under ROC curves. AUROCs estimated the diagnostic performance of the new index, age, RTm, TTPm, eGFR and kidney volume change in the derivation group (A) and validation group (B)