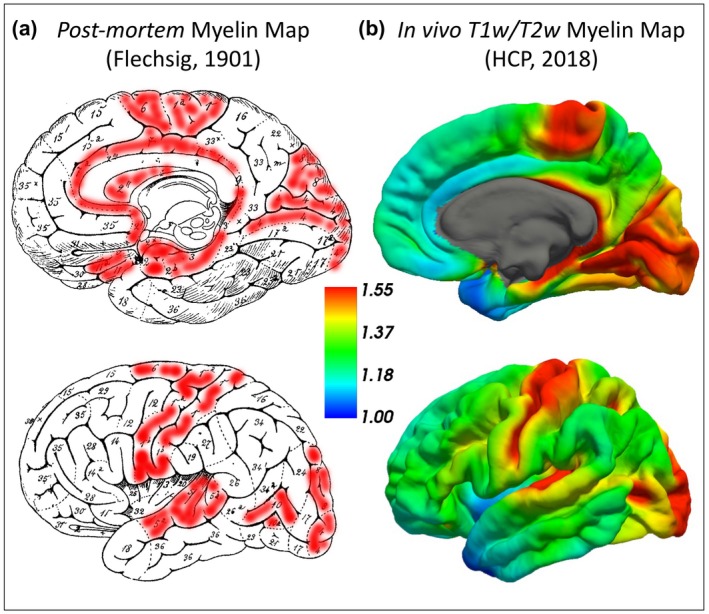
Figure 1.

(a) Flechsig’s postmortem myelination map (modified from Leipsic, 1901). The number indicates the progressive order of myelination and the extent of the intra‐cortical myelin content, with higher numbers representing later myelination during development and consequently lighter local myelin content. The regions shaded in red are the brain regions with earlier myelination and higher intra‐cortical myelin content. These areas strikingly resemble the regions shown in red in B, which are those where higher T1/T2‐weighted signal was identified. (b) In vivo myelo‐architectonic map based on the T1‐/T2‐weighted signal intensity ratio in n = 1,003 participants independently of personality differences. The color bar represents the brain regions with high (red) and low (blue) intra‐cortical myelin content (median values). HCP, Human Connectome Project
