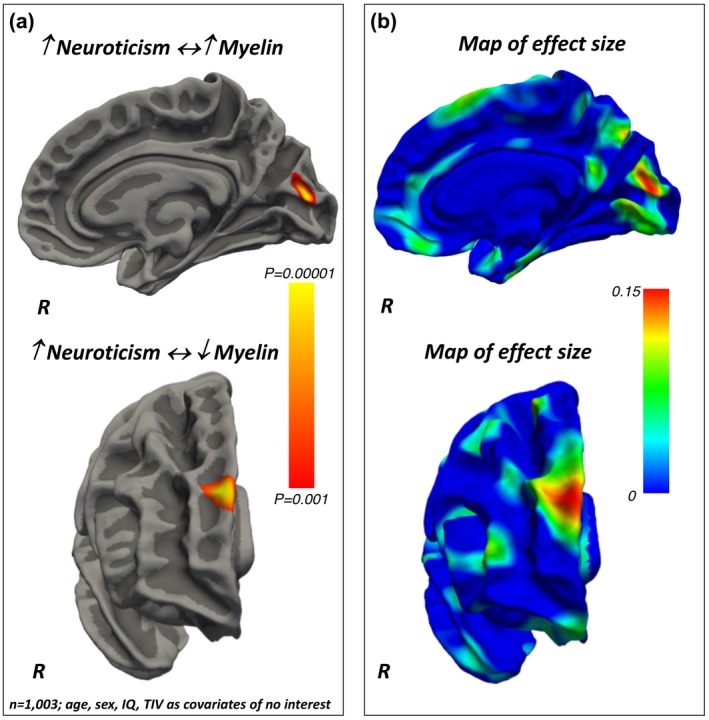
Figure 2.

(a) Positive and negative associations between Neuroticism and regionally specific intra‐cortical myelin content. The color bar represents the p‐values for the associations. (b) Maps of the effect sizes for the findings presented in panel (a). The color bar represents the strength of the effect sizes. IQ, intelligence quotient; TIV, total intracranial volume
