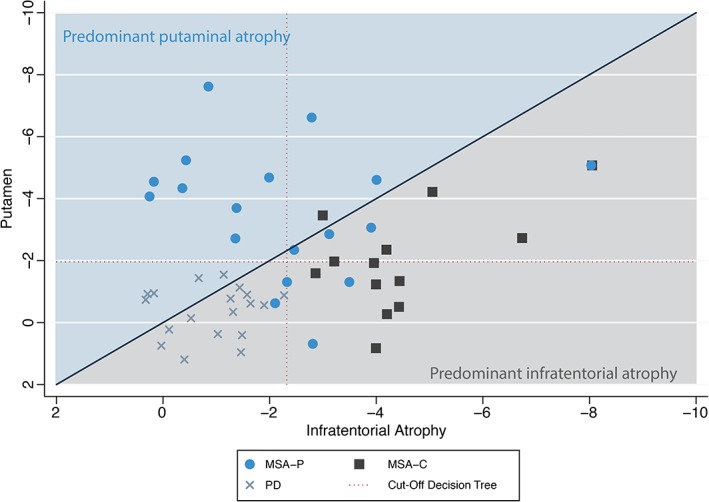
Figure 1.

Scatterplot of brain atrophy patterns in MSA‐P compared with MSA‐C and PD patients. Atrophy of the putamen and the most affected region among the olivo‐ponto‐cerebellar trajectory (ie, middle cerebellar peduncle, cerebellar white matter, cerebellar cortex, pons, labeled “infratentorial atrophy”) are scattered to illustrate the predominant atrophy pattern in any individual patient. [Color figure can be viewed at wileyonlinelibrary.com]
