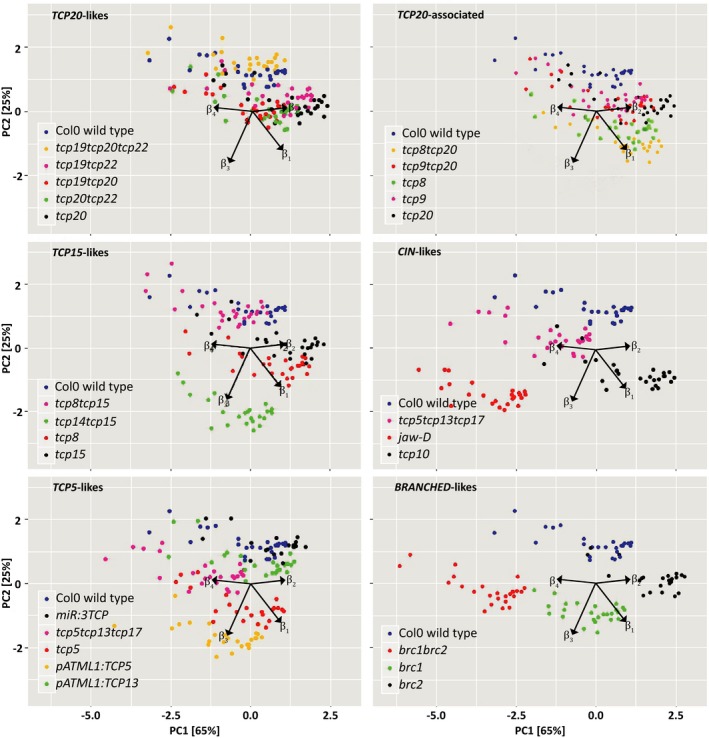
Figure 1.

Principal component analysis (PCA) plots for individual β‐values of all lines in this study. Results of a PCA for all the βs to examine a possible difference in mutants versus wild‐type. For visual clarity the plots are made up for selected subgroups of tcp mutants, always including the Col0 wild‐type as the control. Each data point in the PCA plot represents an individual plant. The β1, β2, β3 and β4 variable loadings are depicted as arrows. Combined, principal components 1 and 2 explain 90% of all variance (PC1 explains 65% of the variation, PC2 explains 25%).
