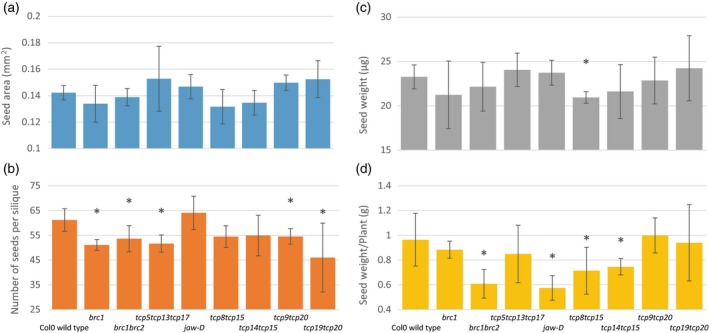
Figure 3.

Genotypes showing differences in yield characteristics.
Quantification of yield characteristics such as average seed area (a), average seed number per silique (b), total seed weight per plant and average weight of the individual seed in (c) and (d) respectively. Only genotypes are shown for which statistically significant differences were found compared with wild‐type control for at least one of the investigated parameters. Average seed number and seed area were determined on four siliques on five plants per genotype. Statistically significant differences with wild‐type (Student's t‐test, P < 0.05) are indicated by an asterisk.
