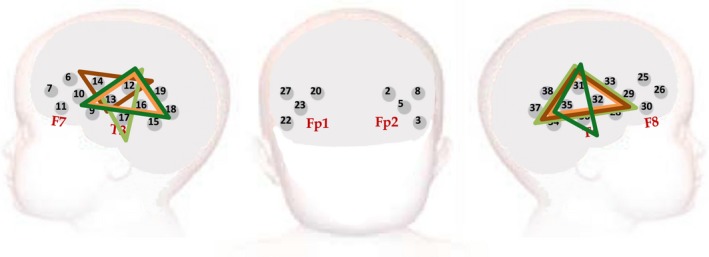
Figure 2.

Representation of the headgear placement on a schematic of the infant head at the 5 and 8‐month time points for each Cohort. The triangles denote the primary ROIs identified during the Cluster Permutation Analyses to identify the region of maximal activation during the Fam1 epoch. These ROIs substantially overlap one another with the UK cohort ROIs denoted in orange (light orange—5 months; dark orange—8 months) and the Gambia cohort ROIs denoted in green (light green—5 months; dark green—8 months)
