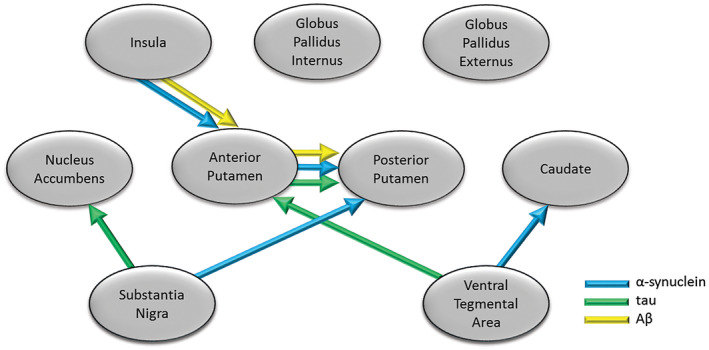
Figure 10.

Modeling of pathology spread in LBD . Structural Equation Model suggesting significant spread along pathways between brain regions based on levels of protein deposition in each region. Arrows indicate significant linkages between brain regions for α‐synuclein, tau and Aβ, where the levels of protein in one region (end of arrow) were significantly related to levels in the other region from which the arrow starts (in this case assumed to be source).
