Figure 4.

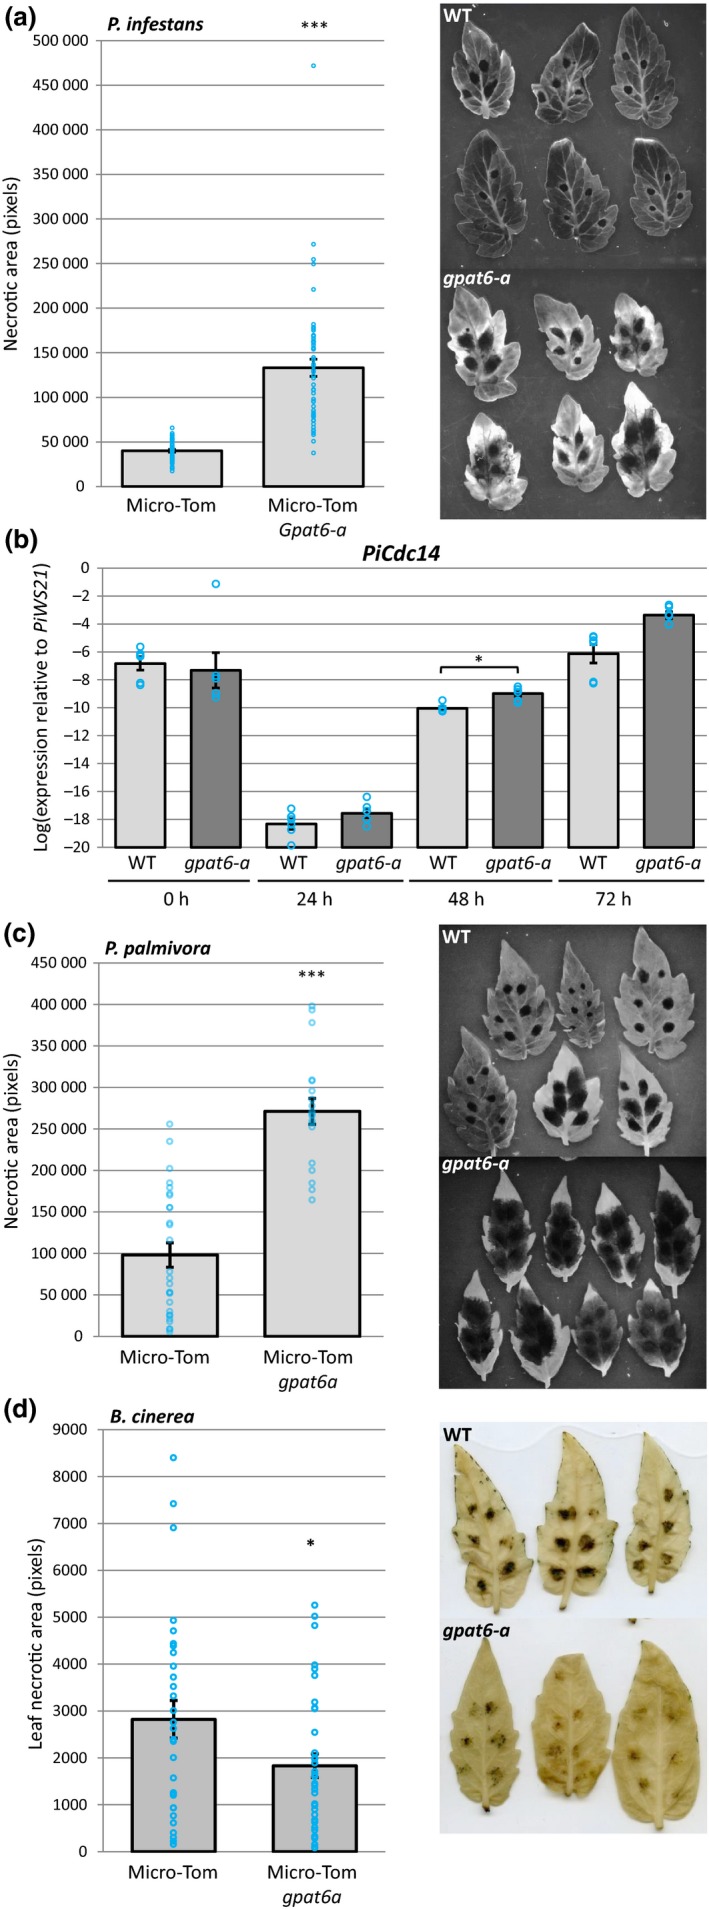
Tomato gpat6a mutants are more susceptible to Phytophthora infestans and Phytophthora palmivora infection but more resistant to Botrytis cinerea infection. (a) Quantification of Micro‐Tom leaf necrotic area at 72 h postinoculation with P. infestans for both wild‐type and gpat6‐a genotypes. Error bars represent ± SE of the mean. Each blue circle indicates the sum of necrotic area for one leaf, four inoculation sites. Representative UV images of wild‐type (WT) and gpat6‐a leaves used for necrotic area quantification are also shown. (b) Expression level of the sporulation‐specific PiCdc14 (sporulation marker) normalized to PiWS21 (40S ribosomal protein S3A). Error bars represent ± SE of the mean of three biological replicates (six technical replicates indicated by blue circles). *, P < 0.05. (c) Quantification of Micro‐Tom leaf necrotic area at 72 h postinoculation with P. palmivora for both WT and gpat6‐a genotypes. Errors bars represent ± SE of the mean (n = 27 for WT, n = 19 for gpat6‐a). Each blue circle indicates the sum of necrotic area for one leaf, six inoculation sites. ***, P < 0.001. (d) Quantification of leaf necrotic area at 6 d postinoculation with B. cinerea. Blue circles represent the total necrotic area for each leaf (six droplets of B. cinerea spore solution). Error bars represent ± SE of the mean (n = 30 for WT, n = 35 for gpat6‐a). Representative images of leaves used to quantify leaf necrotic area are also shown. This experiment was repeated twice with similar results.
