Figure 5.

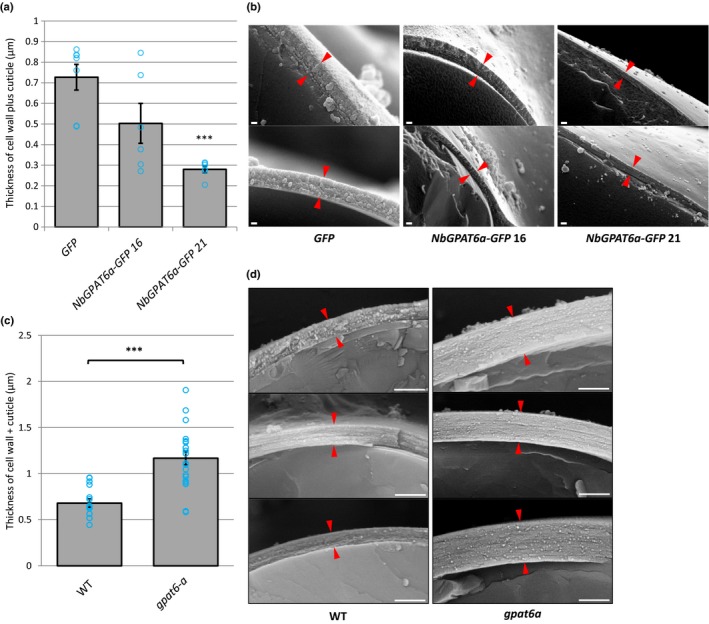
Outer epidermal cell wall thickness is correlated to GPAT6 expression levels. (a) Quantification of cell wall plus cuticle thickness in Nicotiana benthamiana leaves constitutively expressing NbGPAT6a‐GFP. Blue circles represent the mean of three measurements per image (n = 7 for GFP, n = 6 for NbGPAT6a‐GFP 16 and NbGPAT6a‐GFP 21). Error bars represent ± SE of the mean. ***, P < 0.001. (b) Representative cryoscanning electron microscopy (cryo‐SEM) images of transverse fractures used to quantify thickness. Red arrowheads indicate the boundary of cell wall plus cuticle. Scale bars, 200 nm. (c) Quantification of cell wall plus cuticle thickness in leaves of tomato gpat6‐a mutants. Blue circles represent the mean of three measurements per image (n = 15 for wild‐type (WT), n = 20 for gpat6‐a). Error bars represent ± SE of the mean. ***, P < 0.001. (d) Representative cryo‐SEM images of transverse fractures used to quantify thickness. Red arrowheads indicate the boundary of cell wall plus cuticle. Scale bars, 1 μm. This experiment was repeated twice with similar results.
