Figure 6.

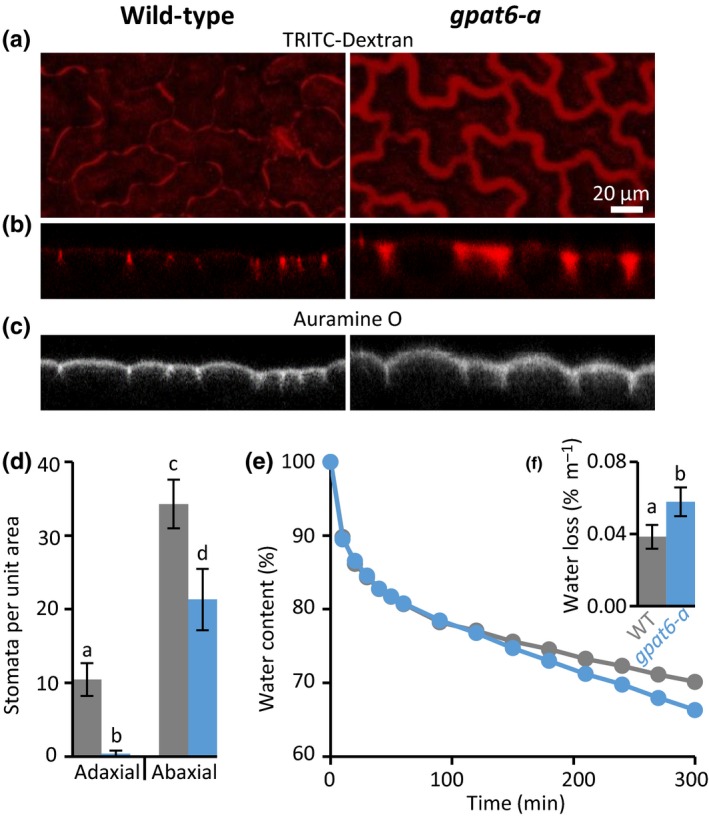
Leaf outer epidermal walls of tomato gpat6‐a mutant display altered porosity, reduced numbers of stomata and increased susceptibility to desiccation. Panels (a)–(c) are of identical magnification represented by the scale bar in (a). TRITC‐Dextran (150 kDa) distribution imaged from above (a) and confocal transects (b) are extended in gpat6‐a mutant epidermal walls. Auramine O was used to label cutin (c). (d) Stomatal numbers per unit leaf area; (e, f) water loss over time and total water loss. Error bars represent ± SD of six biological replicates. Different lowercase letters above error bars indicate significant difference between means.
