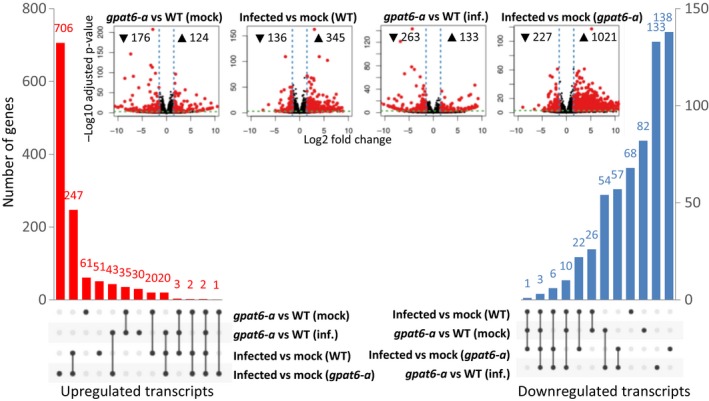
Figure 7.

Transcriptome differences in gpat6‐a vs wild‐type (WT) tomato cv ‘Micro‐Tom’ leaves under control and infection conditions. Water or Phytophthora infestans 88069 zoospores was applied to detached leaves and harvested at 72 h postinoculation. Differentially upregulated (red) and downregulated (blue) transcripts (absolute log fold‐change ≥ 1.5 and adjusted P‐value ≤ 10−3) and pairwise comparison volcano plots (inset) are shown. This figure is based on Supporting Information Dataset S1.
