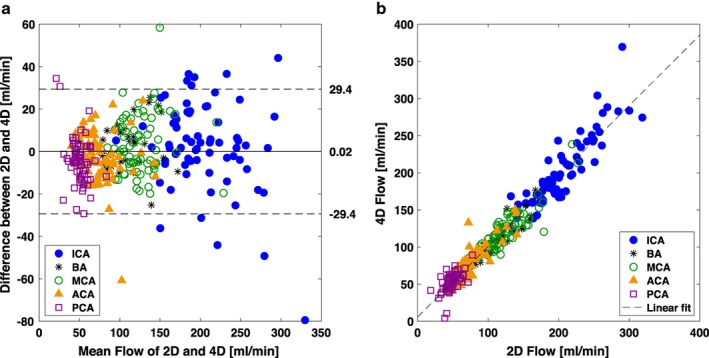
Figure 2.

Bland–Altman analysis and linear correlation between the 2D PCMRI and 4D flow MRI measurements of flow rate for the optimized local thresholding method at 20%. (a) Solid line represents the mean difference between methods and dashed lines represent the 95% limits of agreements. (b) The linear correlation was r = 0.97 (P < 0.001) and the linear model Flow4D = 0.95 Flow2D + 5.76.
