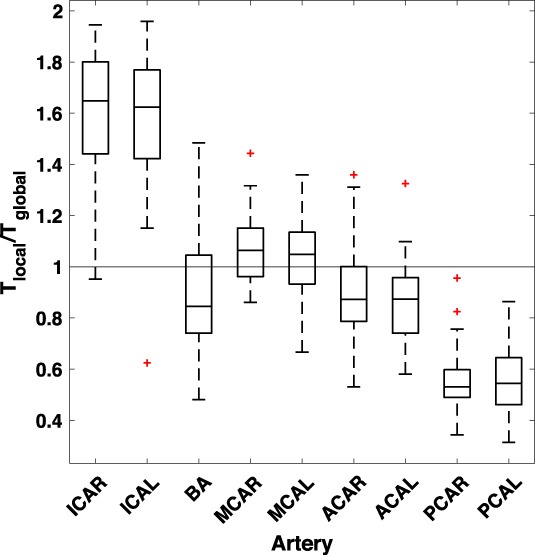
Figure 4.

Boxplot of ratio between local, T local, and global threshold value, T global, for the local and global threshold methods at 20% and 10%, respectively. The bottom and top edge of the box represent the 1st and the 3rd quartile, respectively, and the red + sign the outliers.
