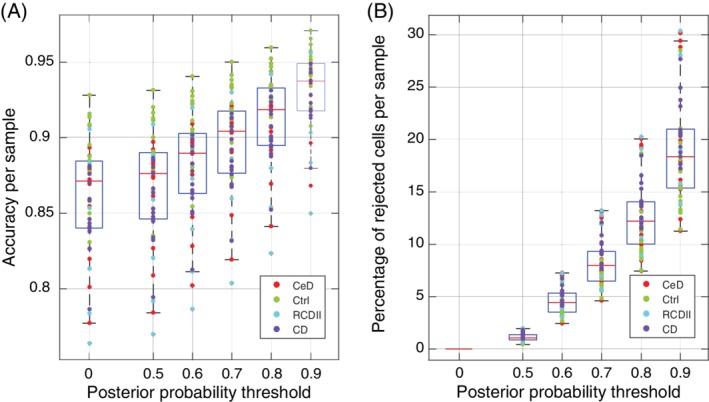
Figure 2.

LDA accuracy and rejection size per sample. (A) boxplot of the LDA accuracy distribution per sample, while using a rejection threshold (0 = no rejection). (B) Boxplot of the rejection percentage per sample while using a rejection threshold (0 means no rejection). Each dot represents a sample colored according to the sample type (CeD: celiac disease; Ctrl: control; RCDII: refractory celiac disease type II; CD: Crohn's disease). [Color figure can be viewed at wileyonlinelibrary.com]
