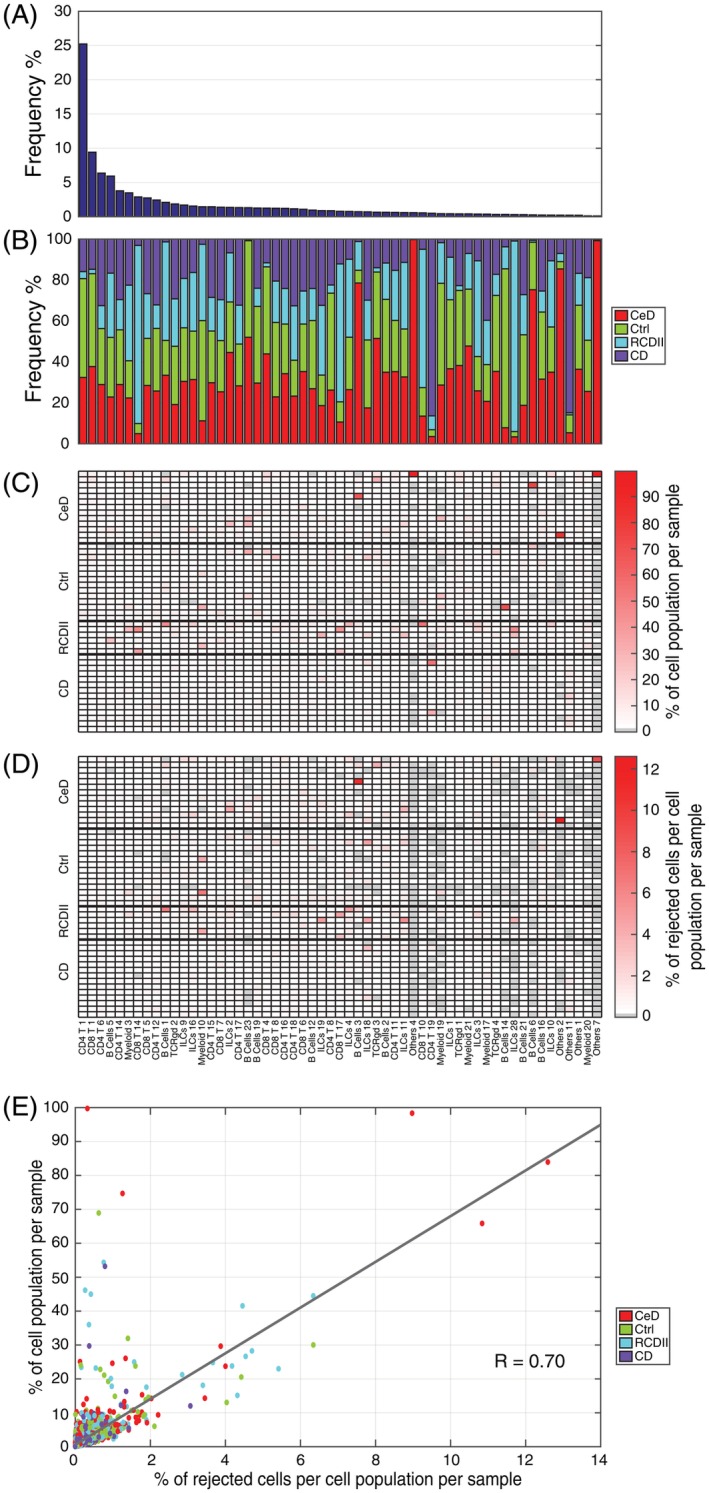
Figure 4.

Rejection option effect on variable sized cell populations. (A) Cell population frequency across the HMIS‐2 dataset, in a descend order. (B) Cell population composition in terms of the different sample types (CeD, Ctrl, RCDII, and CD). (C) Cell population frequencies across samples, normalized by the cell population size across all samples, every column summation is 100%. (D) Percentage of rejected cells per cell population per sample, normalized by the cell population size across all samples, using a posterior probability threshold of 0.7. Cell populations follow the same order for (A–D). (E) Scatter plot between values in (C) and (D) showing a strong correlation of 0.70 between the rejection ratio and the cell population size, per sample. Each point represents a cell population in a particular sample, and points are colored according to the disease status of the sample annotation. [Color figure can be viewed at wileyonlinelibrary.com]
