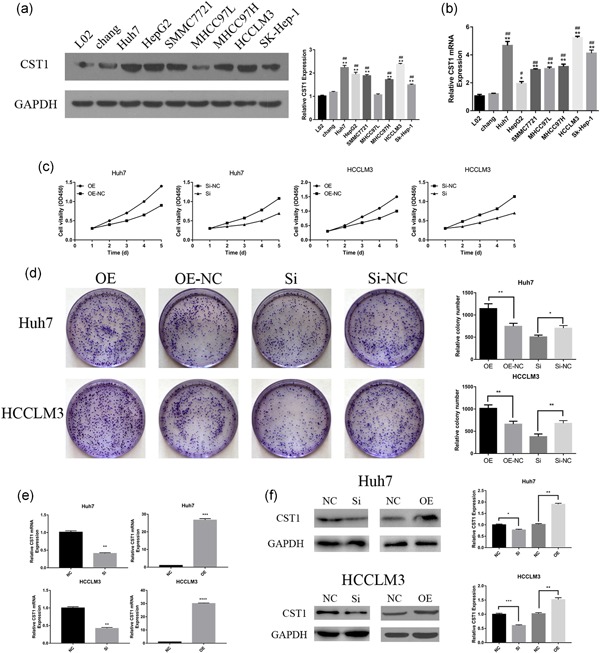
Figure 2.

Expression of CST1 in HCC cell lines and CST1 promoted the growth of HCC cells in vitro. (a) CST1 protein expressed in HCC cell lines (left). Gray value ratio (right). (b) CST1 mRNA expressed in HCC cell lines. (c) Proliferation curves were obtained using CCK8 assays. (d) Colony formation assays (left). Number of colonies counted (right). (e) CST1 was efficiently overexpressed and silenced in Huh7 and HCCLM3 on mRNA level. (f) CST1 was efficiently overexpressed and silenced in Huh7 and HCCLM3 on the protein level. Data are presented as means ± standard deviations of three independent experiments. CCK8: cell counting kit‐8; GAPDH: glyceraldehyde 3‐phosphate dehydrogenase; HCC: hepatocellular carcinoma; mRNA: messenger RNA. NC: negative control; Si: small interfering. *Comparison of HCC cells with L02, *p < .05; **p < .01; and ***p < .001. #Comparison of HCC cells with chang, # p < .05; ## p < .01; and ### p < .001 [Color figure can be viewed at wileyonlinelibrary.com]
