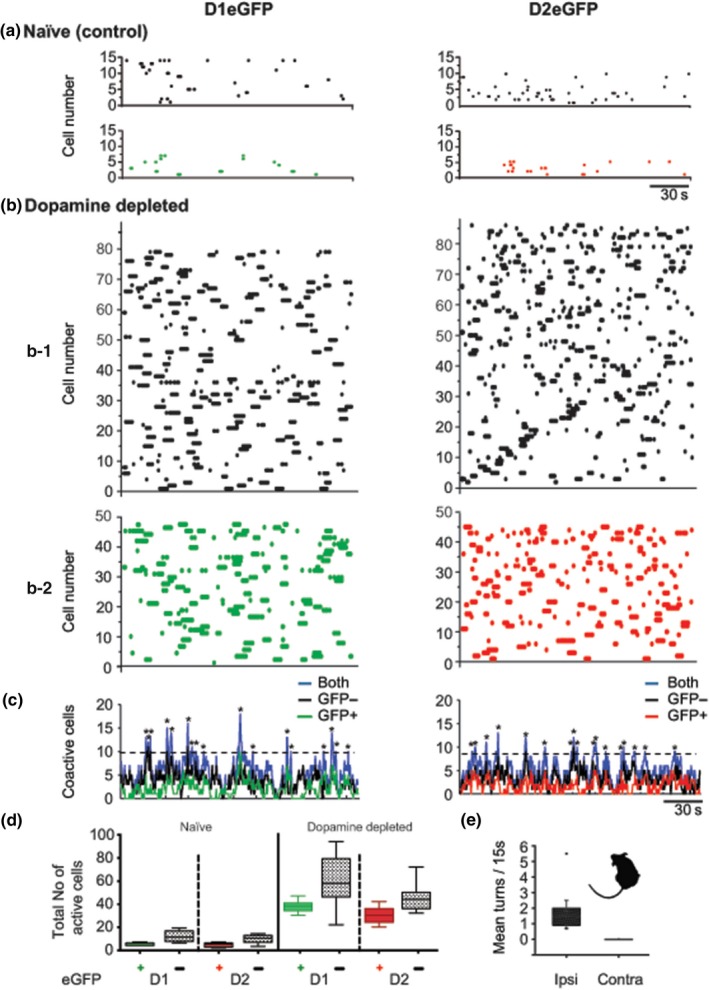
Figure 1.

SPNs of the direct or indirect output pathways (D1‐dSPN or D2‐iSPN) contribute to the synchronized network activity after DA depletion. Data are displayed in raster plots where every dot at any given time along the x axis represents an active neuron identified by its unique number in the Y axis. (a) Representative raster plots of spontaneous striatal activity from D1eGFP (left) and D2 eGFP (right) unlesioned mice. (b) Representative raster plots (top) of D1eGFP (left) and D2eGFP (right) from DA‐depleted animals. (b1) Raster plots of eGPP‐negative neurons, that is, interneurons and the unlabeled SPNs (black dots), (b2) Raster plots of eGPP‐positive neurons of D1 (green) and D2 (red) mice. The increment of neuronal activity after DA depletion compared to controls was statistically significant (one‐way ANOVA (3,28) = 27.12, p < 0.0001). (c) Plots of coincidently firing cells (identified by colors: black: eGFP − negative; green: D1eGFP positive; red: D2eGFPpositive; blue: all recorded neurons, that is, eGFP positive and eGFP negative− together). (d) Box plots of total number of spontaneous active neurons recorded in periods of 180s. (e) Box plot of spontaneous mean rotations recorded on separate experiments. Rotation was toward the side depleted of DA (M = 1.77 turns/15 s, SD 1.35, n = 10 mice). For later comparisons with turns obtained with optogenetic stimulation, turns in DA‐depleted mice were also recorded for 15 s after a 5–10 min period. A contour detection snapshot of a recorded mouse illustrates the deviated posture typical of an ipsilateral DA depletion
