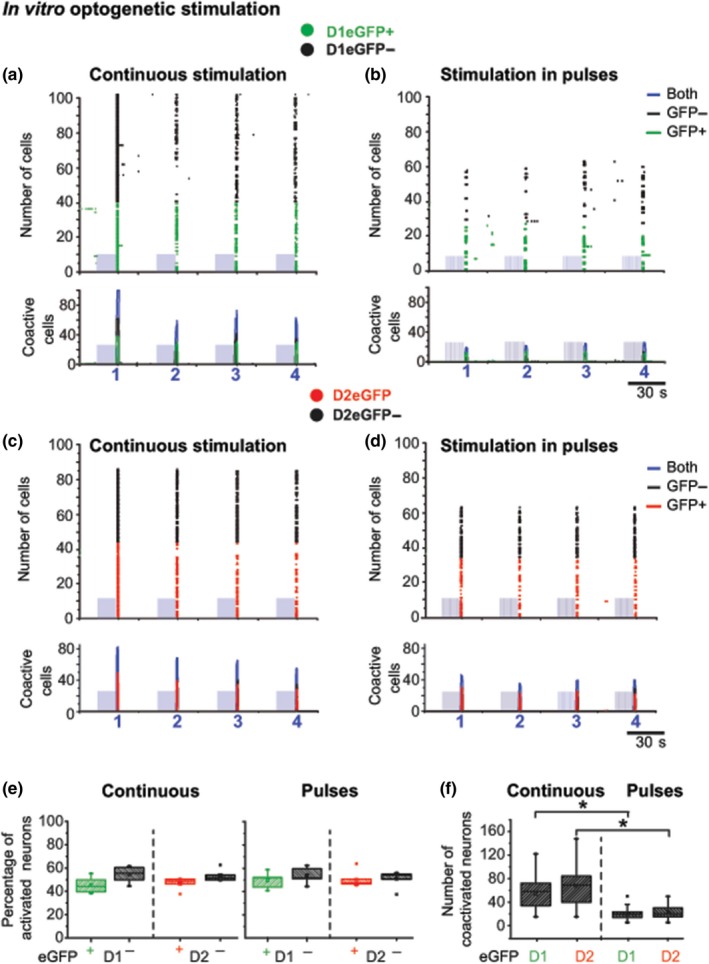
Figure 6.

Comparison of SPN activity of synchronous striatal calcium signals induced by continuous and pulsed patterned optogenetic stimulation. Data are represented in sets of two graphs of striatal activity induced by a blue‐light‐emitting diode (470 nm;1.0 mW at the tip) delivered continuously for 15 s or in patterned pulses (14 Hz/15 s). Top traces: illustrate representative examples of raster plots of ChR2‐induced SPN calcium activity reported by RCaMP1 hr. Bottom traces: illustrate histograms of number of coactivated neurons from continuous (a, c, and e left) or patterned pulsed stimulations (b, d, and e right). Blue rectangles represent the light stimulus artifact (see Figure 4a); colors representing individual active neurons and coactivity are, black: all eGFP negative; green: D1eGFP +; red D2eGFP +. (e) In spite of a differential neuronal activation induced by stimulation delivered continuously or in patterned pulses, the percentage of activated SPNs within groups of positive or negative D1 or D2eGFP neurons remains around 50%, as expected. No preferential neuronal activation was observed. (f) Total number of coactivated neurons from both D1 or D2 neurons with positive eGFP expression. Note that both cell types showed higher synchronization to optogenetic stimulation delivered continuously than in patterned pulses (one‐way ANOVA F(3,92) = 43.56, p ≤ 0.0001)
