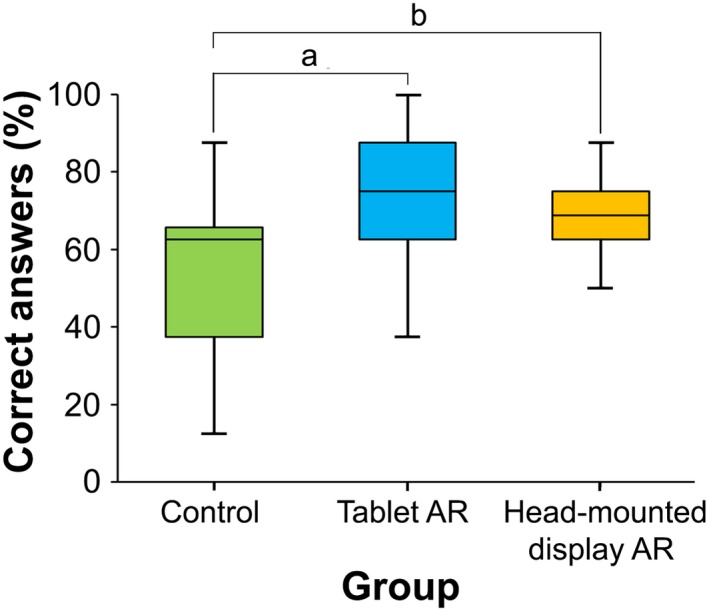
Figure 4.

Box‐and‐whisker plot of the overall mean scores of correct answers (%) obtained in the pathological knowledge test. Control group (n = 32), tablet augmented reality (Tablet AR) group (n = 32), and head‐mounted display AR group (n = 20); a P < 0.001; b P = 0.018 (Wilcoxon rank‐sum test with Bonferroni correction).
